LAB 0
Boryana's baby steps on planet IDV 🪐
Tracking and Understanding My Dietary Patterns
Dataset and Variables
I started collecting diet data on 3/22/2025 and continued recording until 4/2/2025. During that period, I managed to log every single meal and ended up collecting 41 observations in total. I created a spreadsheet and, for the sake of accuracy, logged my meals as soon as possible after I was finished eating. I also had a backup notepad, where I was recording meals while on the go, and copied the observations to the spreadsheet on the next day. That was extremely helpful, as I noticed that I would forget meal times and details after a day of not logging.
I’ve tracked the following variables, which represent the columns in my dataset:
- Timestamp
- Type of Meal (breakfast, lunch, dinner, snack)
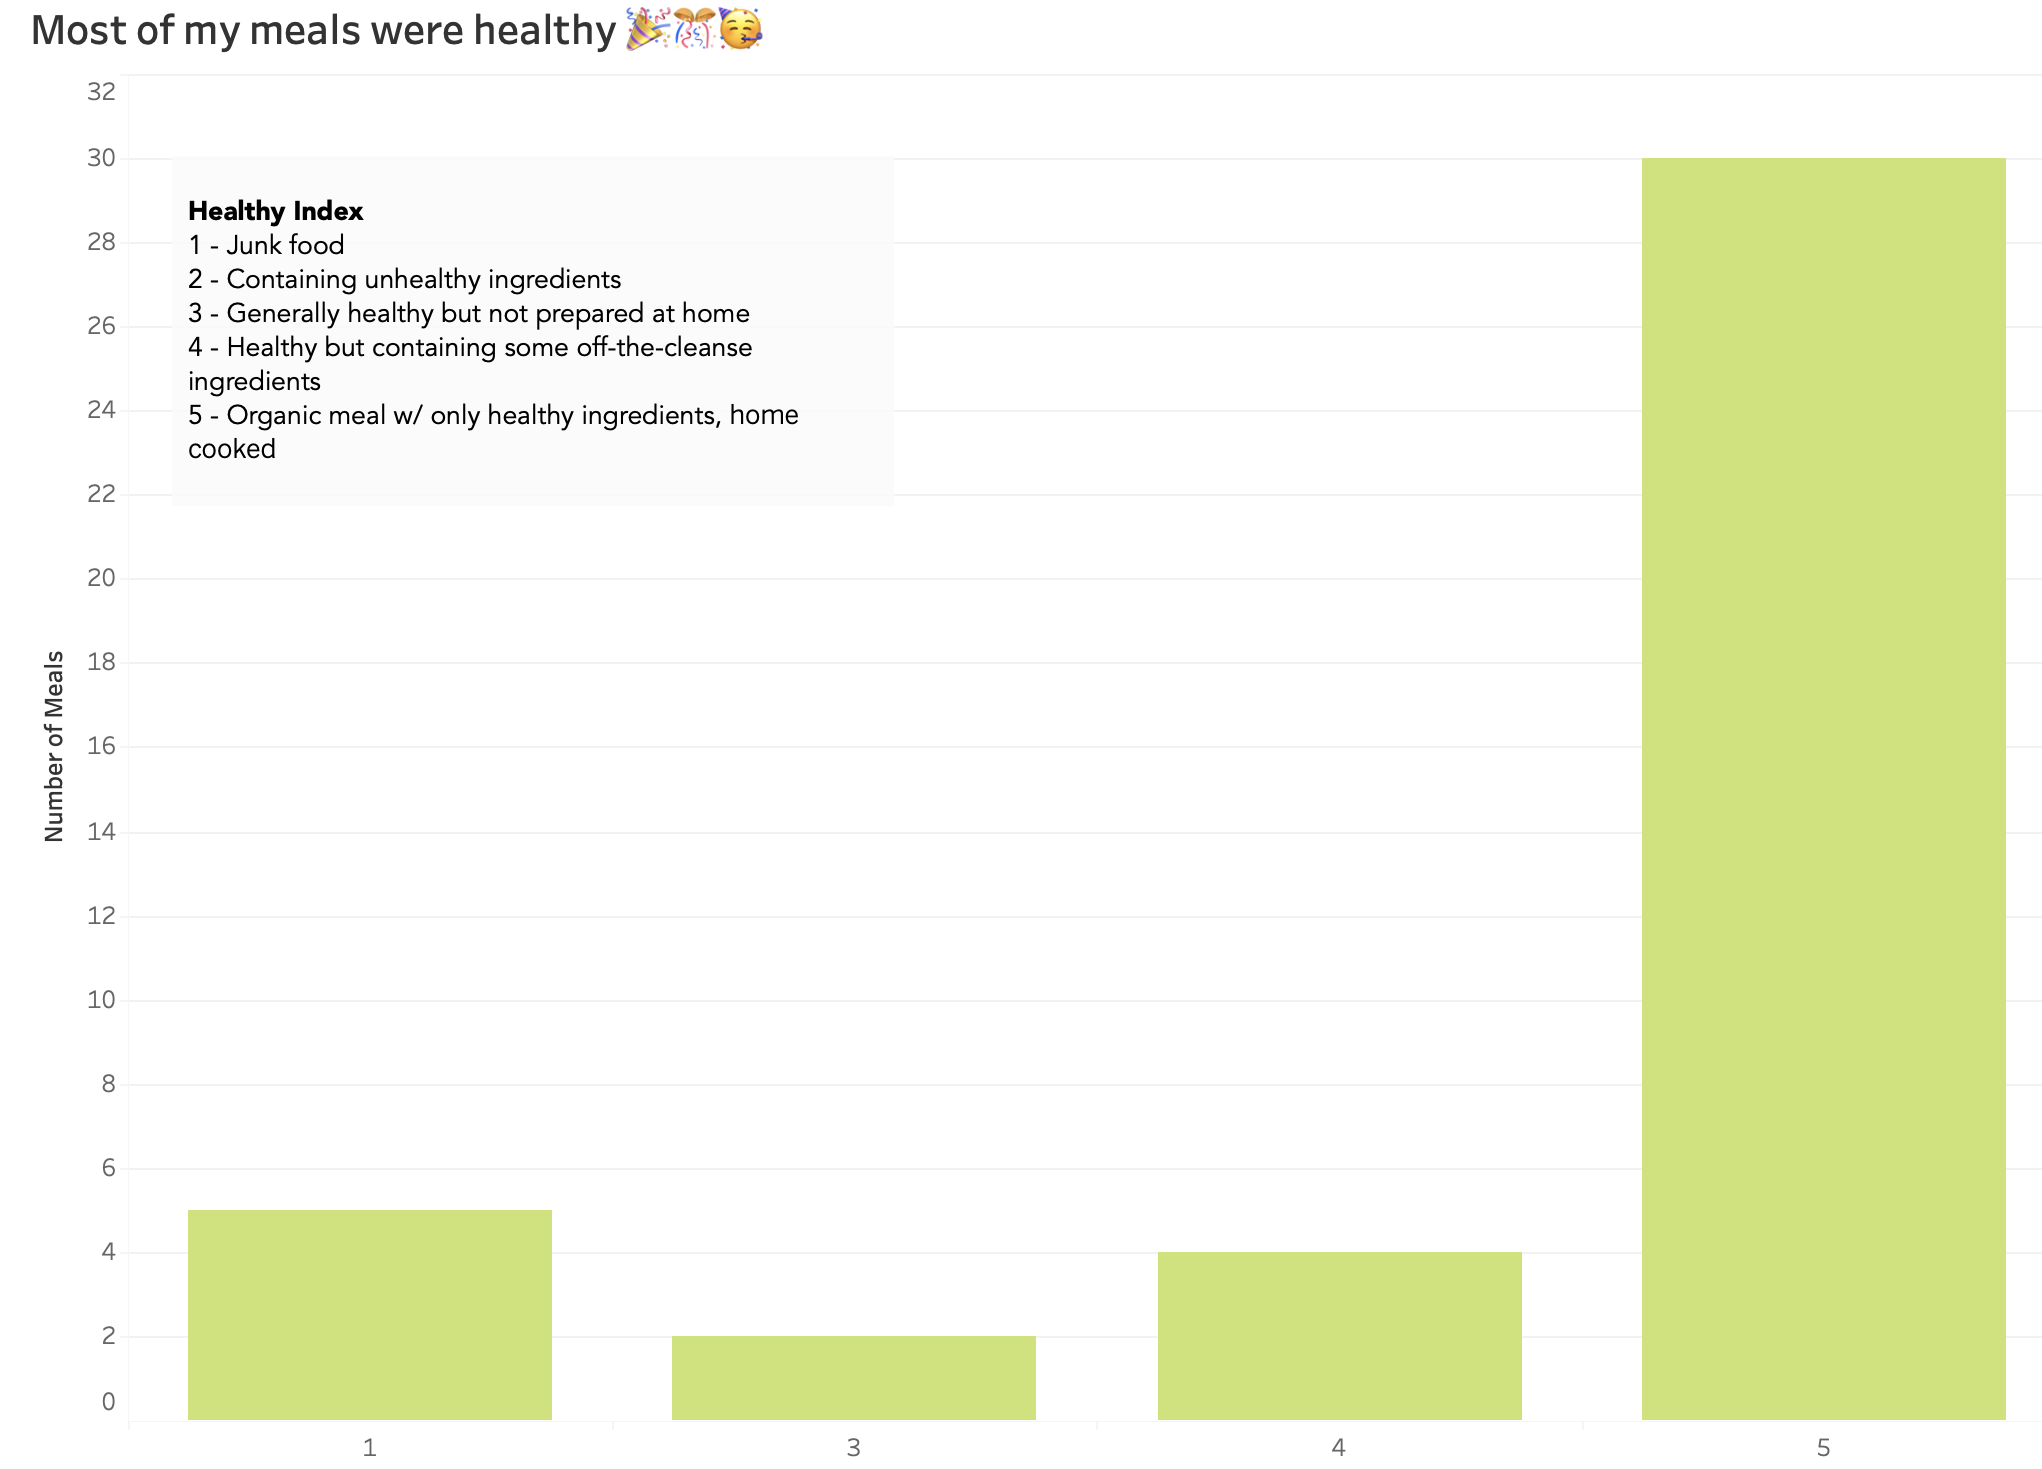
- Healthy Index (on a scale of 1-5)
- Main Meal Ingredient (e.g. rice, potatoes, quinoa, etc.)
- Home-cooked (dummy variable – Yes/No)
- Alcohol Consumption (dummy variable – Yes/No)
- Location (home, office, dine out)
- On Time (dummy variable – Yes/No)
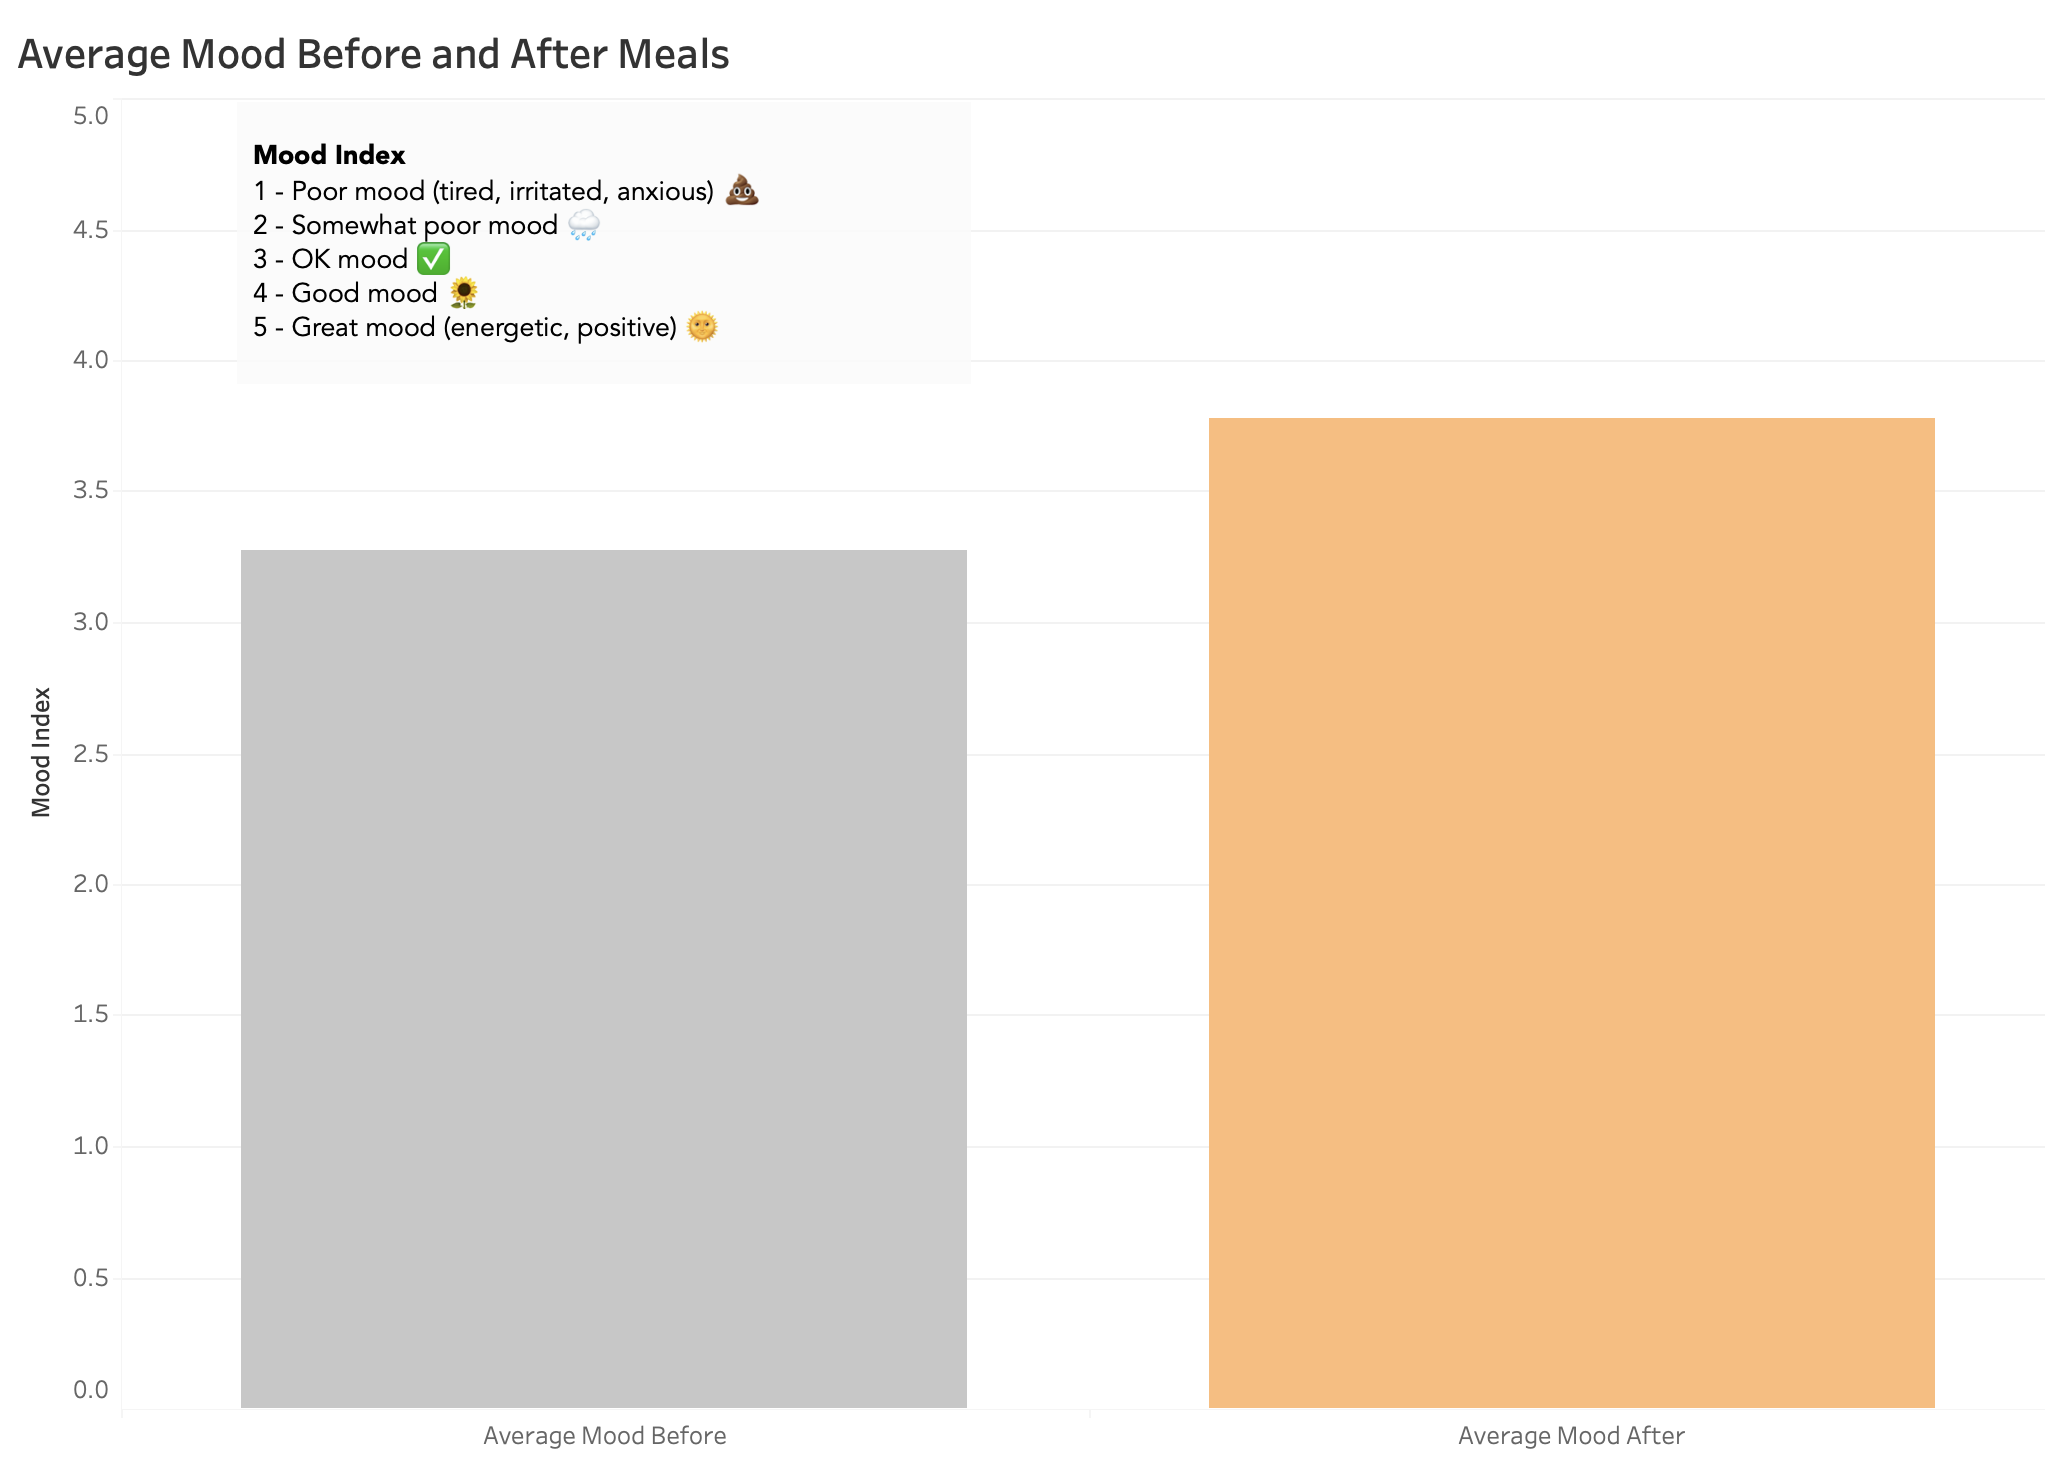
- Mood Before (on a scale of 1-5)
- Mood After (on a scale of 1-5)
- Mood Change (calculated variable I created = [Mood after] – [Mood before])
Health Index
| Rating | Description |
|---|---|
| 1 | Junk food |
| 2 | Containing unhealthy ingredients (refined sugar, fried stuff, etc) |
| 3 | Generally healthy but not prepared at home |
| 4 | Healthy but containing a limited number of off-the-cleanse ingredients |
| 5 | 100% Organic meal containing only healthy ingredients, prepared at home |
Mood Index
| Rating | Description |
|---|---|
| 1 | Poor mood (tired, irritated, anxious) |
| 2 | Somewhat poor mood |
| 3 | OK mood |
| 4 | Good mood |
| 5 | Great mood (energetic, positive) |
Interactive Dashboard