Interactive
Interactive Data Visualizations
A three-part interactive series exploring transit operations, electoral geography, and environmental crisis through data visualization and storytelling.
Research / Data / Policy
Selected Work
A three-part interactive series exploring transit operations, electoral geography, and environmental crisis through data visualization and storytelling.
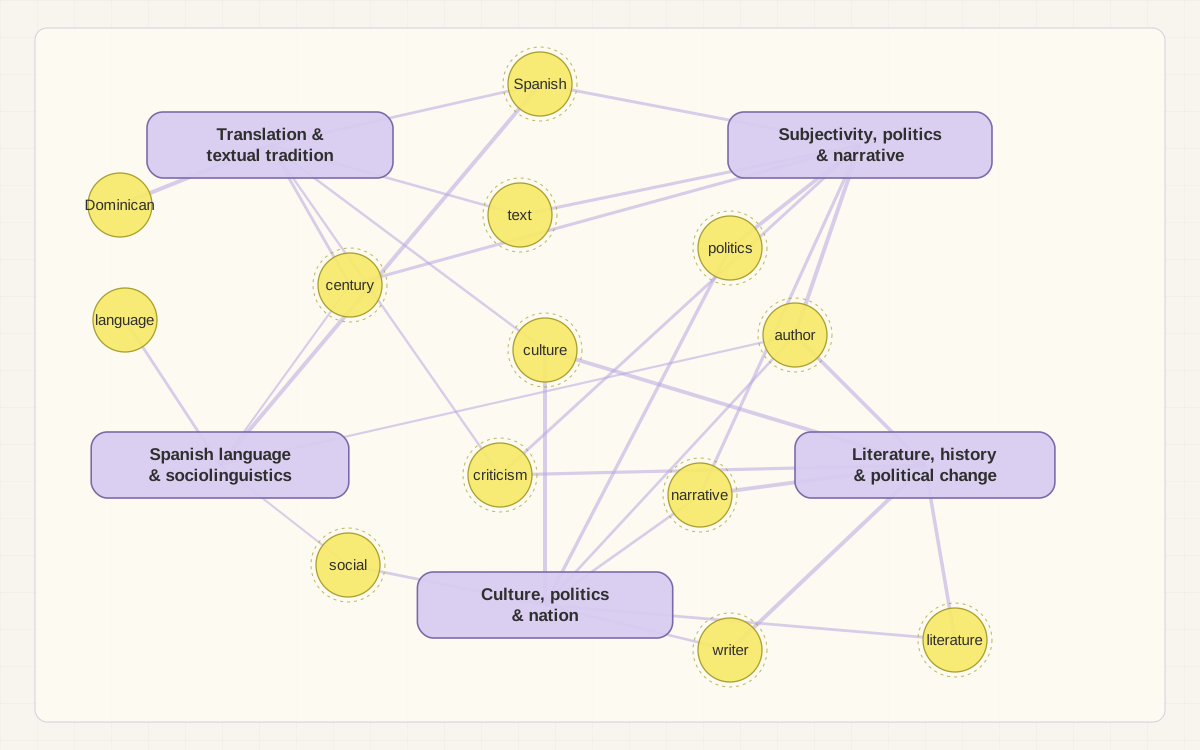
I modeled 196 dissertation abstracts and designed an interactive network to explore five recurring themes, shared terms, and representative research.
An interactive research project comparing how institutions, employer choices, and work design can shape different labor outcomes under similar AI exposure.
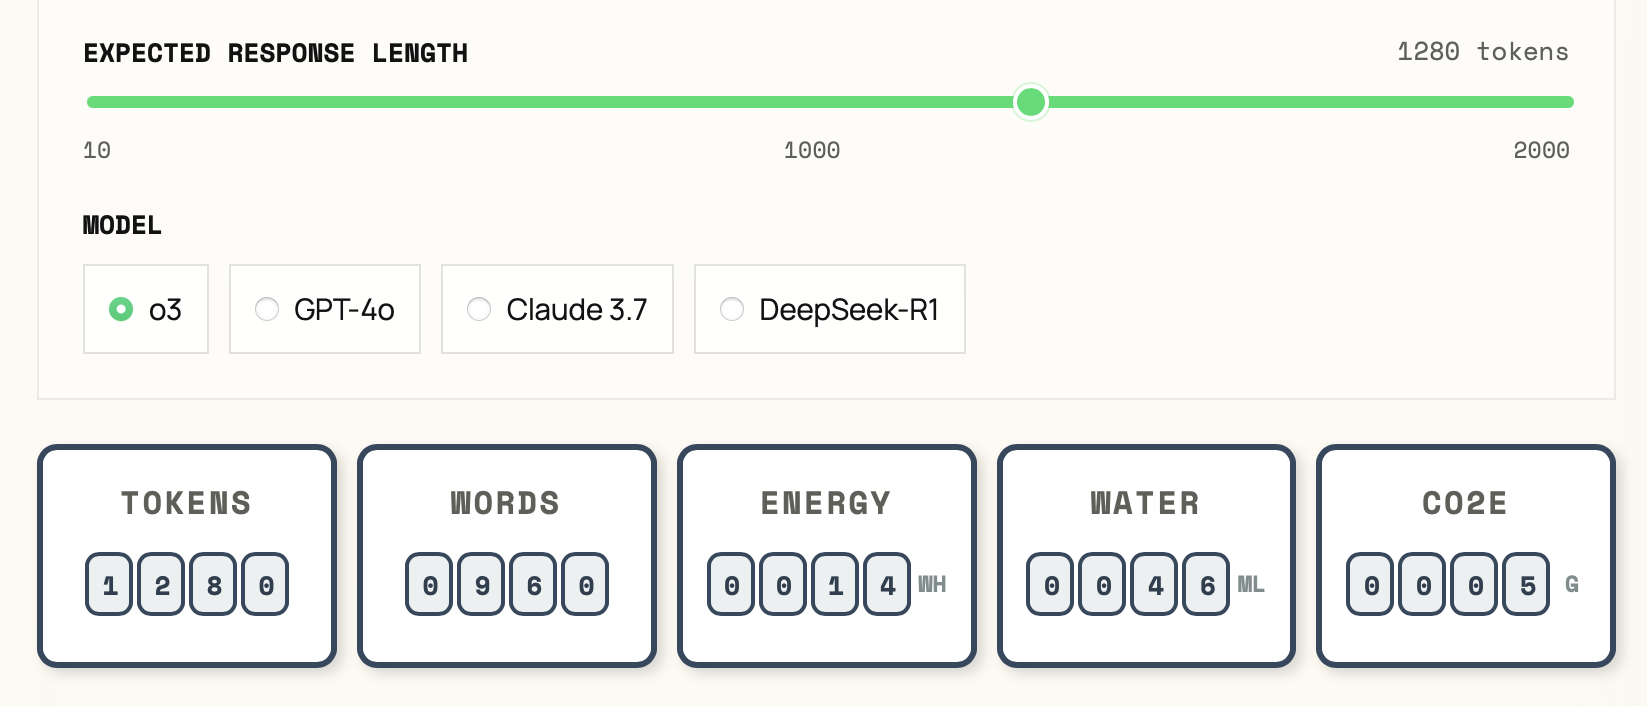
An interactive calculator for estimating the electricity, water, and carbon footprint associated with everyday use of large language models.
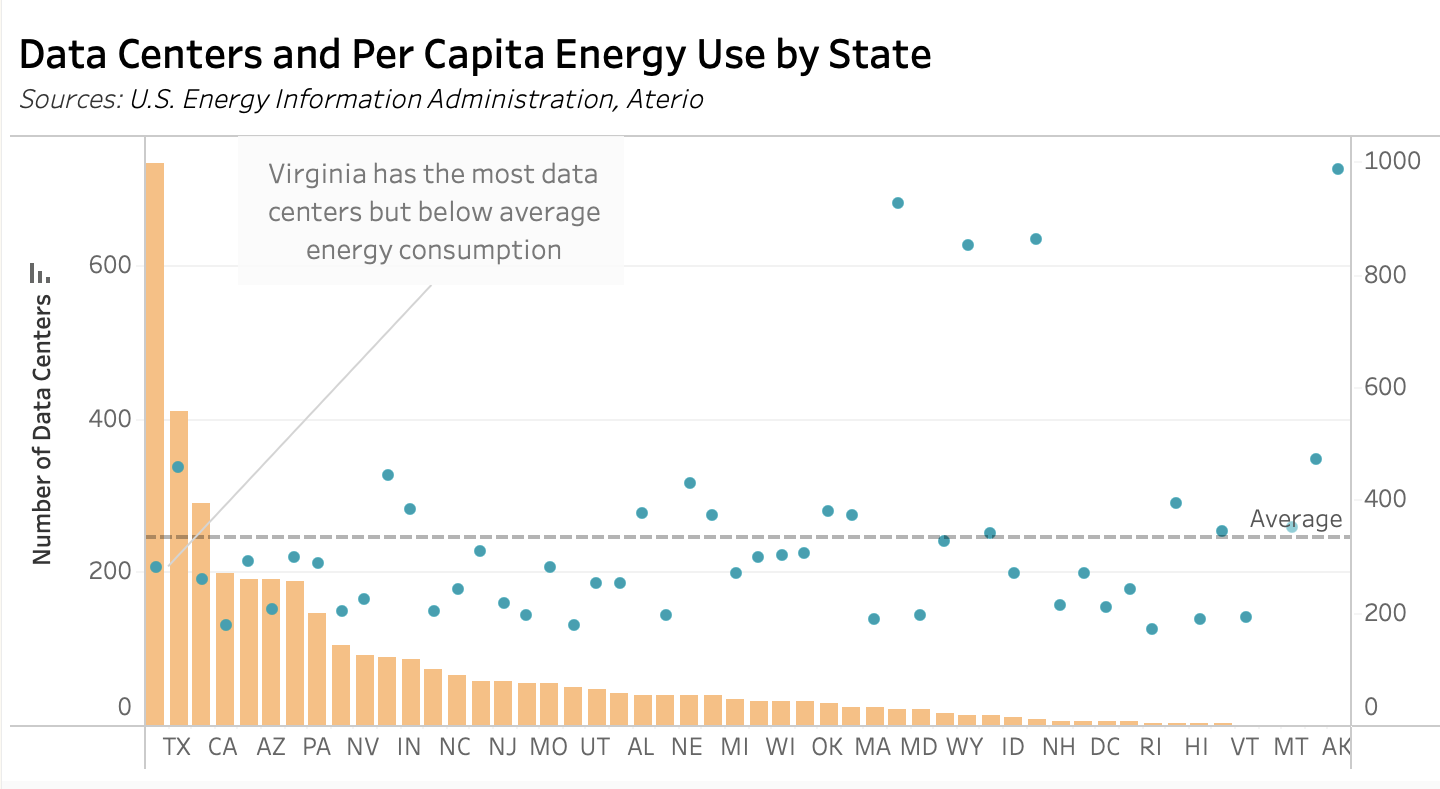
A narrative case study on the water and energy demands of AI systems, using data visualization to examine infrastructure growth, resource use, and public-interest risk.
Approach

With a background in public policy and data analysis, I work across research, visualization, and applied analytics. My work spans responsible technology, labor and socioeconomic policy, and the environmental impacts of digital systems. I have contributed to frameworks, evaluations, and reports designed to inform institutional priorities and strategy, and I’m especially interested in projects that use research, data, and visual narrative to help institutions understand technical systems and make informed decisions in complex and evolving contexts.